Page 39 - 《华中农业大学学报》2025年第3期
P. 39

第 3 期                  梁盼 等:稻-鸭-虾综合种养模式与其他稻田种养模式效率比较                                       33

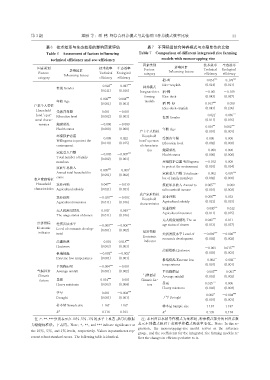
                      表6 技术效率与生态效率的影响因素评估                           表7 不同稻田综合种养模式与水稻单作的比较
                      Table 6 Assessment of factors influencing   Table 7 Comparison of different integrated rice farming
                        technical efficiency and eco-efficiency           models with monocropping rice
                                                                  因素类别                       技术效率     生态效率
                  因素类别                        技术效率    生态效率        Factors       影响因素         Technical  Ecological
                                 影响因素                                         Influencing factors
                  Factors                     Technical  Ecological   category                efficiency  efficiency
                              Influencing factors
                  category                    efficiency  efficiency
                                                                           稻-虾               -0.053 ***  -0.178 ***
                                                   **      ***             Rice-crayfish      (0.014)  (0.017)
                                              -0.025  -0.067      种养模式
                           性别 Gender
                                               (0.011)  (0.016)  Integrated rice 稻-鸭          -0.061  -0.109
                                                                   farming   Rice-duck        (0.043)  (0.067)
                                               0.002 ***  0.004 ***
                           年龄 Age                                  models
                                               (0.001)  (0.001)            稻-鸭-虾              0.163 ***  -0.050
                户主个人特征
                                                                           Rice-duck-crayfish  (0.047)  (0.106)
                 Household   受教育年限             0.001   -0.001
                                                                                                   *       ***
                 head’s per‐                                                                  -0.021  -0.065
                           Education level     (0.002)  (0.003)            性别 Gender
                 sonal charac‐                                                                (0.011)  (0.016)
                   teristics  健康状况             -0.000  -0.000
                                                                                              0.001 **  0.002 ***
                           Health status       (0.000)  (0.000)            年龄 Age
                                                                户主个人特征                        (0.001)  (0.001)
                           环境保护意愿                                Household
                                               -0.008   0.022              受教育年限               0.000   0.000
                           Willingness to protect the           head’s person‐
                                               (0.010)  (0.015)            Education level    (0.002)  (0.003)
                           environment                           al characteris‐
                                                                    tics   健康状况               -0.000   0.000
                           家庭总人口数
                                               -0.002  -0.007 ***          Health status      (0.000)  (0.000)
                           Total number of family
                                               (0.002)  (0.003)
                           members                                         环境保护意愿 Willingness   -0.012  0.009
                           家庭年总收入                                          to protect the environment  (0.010)  (0.014)
                                               0.005 ***  -0.003  *
                           Annual total household in‐                      家庭总人口数 Total num‐  -0.002  -0.007 ***
                                               (0.001)  (0.002)
                           come                                            ber of family members  (0.002)  (0.003)
                农户家庭特征
                 Household   农业补贴              0.047 **  -0.010            家庭年总收入 Annual to‐  0.005 ***  -0.002
                 characteristics Agricultural subsidy  (0.021)  (0.021)    tal household income  (0.001)  (0.002)
                                                                农户家庭特征
                           农业保险               -0.038 ***  -0.002           农业补贴               0.056 ***  0.012
                                                                 Household
                           Agricultural insurance  (0.011)  (0.016)        Agricultural subsidy  (0.021)  (0.019)
                                                                 characteristics
                                                                           农业保险              -0.040 ***  -0.012
                           无人机使用情况             0.020 *  -0.069 ***
                                                                           Agricultural insurance  (0.011)  (0.015)
                           The usage status of drones  (0.011)  (0.016)
                                                                           无人机使用情况 The us‐    0.042 ***  0.011
                  经济指标     经济发展水平
                                              -0.009 ***  -0.006 ***       age status of drones  (0.013)  (0.017)
                  Economic  Level of economic develop‐
                                               (0.001)  (0.002)
                   indicator  ment                                经济指标     经济发展水平 Level of   -0.009 ***  -0.006 ***
                                                                  Economic
                                                                           economic development  (0.002)  (0.002)
                           高温热浪                -0.001  0.018 ***   indicator
                           Heatwave            (0.003)  (0.003)
                                                                                              -0.003   0.015 ***
                                                                           高温热浪 Heatwave
                           极端低温               -0.002 **  -0.002  *                            (0.003)  (0.003)
                           Extreme low temperatures  (0.001)  (0.001)                             **       ***
                                                                           极端低温 Extreme low   -0.002  -0.002
                                                                           temperatures       (0.001)  (0.001)
                           平均降雨量              -0.004 ***  -0.001
                  气候因素     Average rainfall    (0.001)  (0.002)            平均降雨量             -0.005 ***  -0.003 **
                  Climatic                                        气候因素     Average rainfall   (0.001)  (0.002)
                   factors  暴雨                 0.014 ***  -0.001  Climatic fac‐
                           Heavy rainstorm     (0.003)  (0.004)     tors   暴雨                 0.015 ***  0.006
                                                                           Heavy rainstorm    (0.003)  (0.004)
                           干旱                  0.001  -0.004 ***
                                                                                              0.002 *  -0.004 ***
                           Drought             (0.001)  (0.001)            干旱 Drought
                                                                                              (0.001)  (0.001)
                           样本量 Sample size     1 167    1 167              样本量Sample size      1 167   1 167
                           R  2                0.118    0.103              R 2                 0.139   0.174
                 注:*、**、***分别表示在 10%、5%、1% 的水平上显著,括号内数据          注:本回归以水稻单作模式为基准组,种养模式部分的回归系数
                                                                表示不同模式相对于水稻单作模式的效率变化。Note: In this re‐
               为稳健标准误。下表同。Note: *, **, and *** indicate significance at
                                                                gression,  the  monocropping-rice  model  serves  as  the  reference
               the 10%, 5%, and 1% levels, respectively. Values in parentheses rep‐
                                                                group, and the coefficients for the integrated rice farming models re‐
               resent robust standard errors. The following table is identical.  flect the changes in efficiency relative to it.
   34   35   36   37   38   39   40   41   42   43   44