
Page 29 - 《华中农业大学学报(自然科学版)》2023年5期
P. 29
第 5 期 宫进波 等:南疆地区玉米和棉花的氮磷钾肥利用效率及影响因素 23
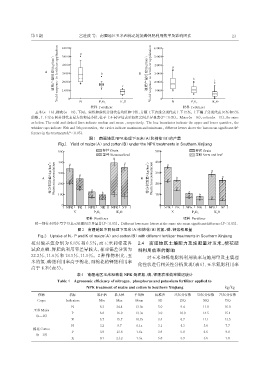
玉米(n=16),棉花(n=19),下同。实线和虚线分别代表均值和中值,方框上下边缘分别代表上下 25%,上下帽子分别代表 95% 和 5%
的数,上下实心圆分别代表最大值和最小值,柱子上不同字母表示各组之间差异显著(P<0.05)。Maize(n=16),cotton(n=19),the same
as below.The solid and dashed lines indicate median and mean ,respectively. The box boundaries indicate the upper and lower quartiles, the
whisker caps indicate 95th and 5th percentiles, the circles indicate maximum and minimum, different letters above the bars mean significant dif⁃
ference in the treatments(P<0.05).
图1 南疆地区NPK处理下玉米(A)和棉花(B)的产量
Fig.1 Yield of maize(A) and cotton(B) under the NPK treatments in Southern Xinjiang
同一部位不同小写字母表示处理间差异显著(P<0.05)。Different lowercase letters at the same site mean significant difference(P<0.05).
图2 南疆地区不同处理下玉米(A)和棉花(B)的氮、磷、钾素积累量
Fig.2 Uptake of N, P and K of maize(A) and cotton(B) with different fertilizer treatments in Southern Xinjiang
相对偏差值分别为 6.8% 和 6.5%;而玉米和棉花各 2.4 南疆地区土壤肥力及施肥量对玉米、棉花肥
试验点磷、钾肥的利用率差异较大,相对偏差分别为 料利用效率的影响
22.2%、11.6% 和 18.5%、11.9%。2 种作物相比,玉 对玉米和棉花肥料利用效率与施用量及土壤理
米的氮、磷肥利用率高于棉花,而棉花的钾肥利用率 化性状进行相关性分析发现(表 6),玉米氮肥利用率
高于玉米(表5)。
表4 南疆地区玉米和棉花 NPK 处理氮、磷、钾肥农学效率描述统计
Table 4 Agronomic efficiency of nitrogen, phosphorus and potassium fertilizer applied to
NPK treatment of maize and cotton in Southern Xinjiang kg/kg
作物 指标 最小值 最大值 平均值 标准差 25%分位数 50%分位数 75%分位数
Crops Indicators Min Max Mean SD 25Q 50Q 75Q
N 8.2 24.4 13.0a 5.0 9.4 11.0 16.0
玉米 Maize
P 6.6 16.9 13.3a 3.0 10.9 14.5 15.4
(n=16)
K 5.7 15.7 10.7a 3.4 6.7 11.1 13.5
N 3.2 9.7 6.1a 3.1 4.3 5.6 7.7
棉花 Cotton
P 3.9 13.8 7.6a 3.9 5.8 6.6 9.8
(n=19)
K 0.7 21.2 7.5a 5.8 3.9 5.6 7.8